MinuteRead
30 min
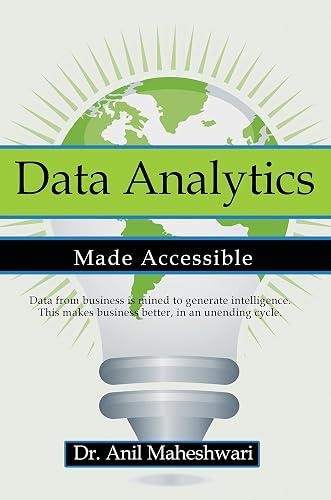
Book summary
by Anil Maheshwari
Premium summary · Opens in the app · 30 min read
Every day, businesses generate staggering amounts of data. Every transaction, every customer interaction, every website visit, every supply chain movement leaves a digital trail. Yet most organizations are data-rich and insight-poor. They collect information endlessly but struggle to extract meaning from it. The gap between having data and using data effectively is one of the greatest competitive divides in modern business.
**Author:** Anil Maheshwari
**Estimated Reading Time:** 45 minutes
**What You'll Learn:**
- The complete Business Intelligence and Data Mining cycle and why it drives modern organizations - How to recognize patterns hidden in raw data and turn them into competitive advantage - The core techniques every data analyst must understand, from decision trees to association rules - How to build a data warehouse that serves real decision-making needs - Practical ways to apply analytics in your own work, regardless of your technical background
**Who This Book Is For:**
This book is for anyone who wants to understand data analytics without drowning in technical jargon. Whether you are a manager making decisions based on reports, a student exploring career options, an entrepreneur seeking insights from customer data, or a professional who wants to speak the language of data fluently, this condensed edition will give you a solid foundation. No programming experience or advanced mathematics is required.
Every day, businesses generate staggering amounts of data. Every transaction, every customer interaction, every website visit, every supply chain movement leaves a digital trail. Yet most organizations are data-rich and insight-poor. They collect information endlessly but struggle to extract meaning from it. The gap between having data and using data effectively is one of the greatest competitive divides in modern business. This problem is not new, but it has become urgent. The volume of data created worldwide doubles roughly every two years. Companies that can analyze this data quickly and accurately gain advantages in pricing, customer service, product development, and operational efficiency. Companies that cannot are left reacting to events they should have anticipated. Anil Maheshwari wrote Data Analytics Made Accessible to bridge this gap. Drawing on his experience teaching business students and working professionals, he recognized that most people do not need to become data scientists. They need to understand what data analytics can do, how the core techniques work, and how to ask the right questions when working with data professionals. His approach is deliberately accessible, focusing on concepts rather than code, on understanding rather than implementation details. The central insight of the book is that data analytics is not a technical specialty reserved for a few experts. It is a way of thinking that can be learned by anyone willing to approach problems systematically. The tools and techniques may evolve, but the underlying logic remains constant: observe, analyze, understand, and improve. What makes Maheshwari's approach distinctive is his emphasis on the complete cycle of analytics. Many books teach individual techniques in isolation. Maheshwari shows how these techniques fit together into a continuous loop of improvement. Data is collected, stored, analyzed, visualized, and then fed back into decision-making, which generates new data, which…
Continue reading in the MinuteRead app
Get the complete 30-minute summary of Data Analytics Made Accessible
Get the complete summary in the appThe BIDM cycle is the core framework: record activities, analyze data, generate insights, feed insights back into the bu
Patterns are the raw material of insight. Temporal patterns show regular occurrences over time, spatial patterns show or
A data warehouse is an organized store of data designed for management decisions, characterized by being subject-oriente
Data mining discovers valid, novel, potentially useful, and understandable patterns from data. It should be applied to h
Decision trees classify by asking the most important questions first. They are transparent, versatile, and widely used.
Regression models the relationship between independent variables and a dependent variable. It enables prediction but doe
"Data Analytics Made Accessible" is a strong fit if you want practical ideas around business, technology, science, especially themes like the bidm cycle is the core framework: record activities, analyze data, generate insights, feed insights back into the bu; patterns are the raw material of insight. temporal patterns show regular occurrences over time, spatial patterns show or. The MinuteRead summary distills these concepts into a focused read, whether you're deciding whether to buy the book or applying its lessons at work.
Motivated to help readers with any business organization needs to continually monitor its business environment and its own performance, Anil Maheshwari wrote “Data Analytics Made Accessible” to package those ideas for a fast, focused read. In “Data Analytics Made Accessible”, Anil Maheshwari focuses on any business organization needs to continually monitor its business environment and its own performance. Through “Data Analytics Made Accessible”, Anil Maheshwari distills the core ideas on busine…
Continue Reading
Access the complete 30-minute summary and thousands more nonfiction books in the MinuteRead app.

Continue reading the complete summary in the MinuteRead app.