MinuteRead
30 min
Every day, millions of traders sit in front of screens crowded with indicators. Moving averages in five colors. Oscillators in subpanels. Bollinger Bands. MACD. RSI. Stochastic. Fibonacci retracements drawn across every swing. They believe that more information means better decisions. They believe that if they can just find the right combination of tools, the market will finally reveal its secrets.
**Author:** Al Brooks
**Estimated Reading Time:** 45 minutes
**What You'll Learn:**
- Why stripping away indicators gives you a clearer view of the market - How to read every bar as a footprint of institutional activity - The spike and channel framework that explains nearly every trend - How to use the always-in test to stay on the right side of the market - Why most reversals and breakouts fail, and how to profit from that reality - The High 1 and High 2 entry system for trading pullbacks - Why the strongest trends deliberately look weak - How to apply the trader's equation to every decision
**Who This Book Is For:**
This book is for traders who have struggled with indicator overload, who have watched their carefully planned trades fail while the market moved without them, and who suspect that the answer lies not in more complexity but in learning to read what the chart is already telling them. It is for anyone who wants to understand how institutional money moves markets and how to follow those footprints with discipline and clarity.
Every day, millions of traders sit in front of screens crowded with indicators. Moving averages in five colors. Oscillators in subpanels. Bollinger Bands. MACD. RSI. Stochastic. Fibonacci retracements drawn across every swing. They believe that more information means better decisions. They believe that if they can just find the right combination of tools, the market will finally reveal its secrets. Al Brooks spent over ten thousand hours testing indicators and automated systems before reaching a conclusion that would reshape his entire approach to trading. The indicators were not helping. They were obscuring the only thing that mattered: price itself. The problem is not that traders lack information. The problem is that they have too much of it, and most of it is redundant. Every indicator is derived from price. A moving average is simply a smoothed version of past prices. An oscillator is a mathematical transformation of recent closes. When you stack five indicators on a chart, you are looking at five delayed, filtered versions of the same underlying data. You are not gaining new information. You are losing clarity. Brooks arrived at a radical simplification. He trades exclusively off a single five-minute candle chart with a twenty-bar exponential moving average. That is all. No oscillators. No MACD. No Bollinger Bands. No volume indicators. Just price bars and one reference line. The reasoning is straightforward. If every indicator is derived from price action, then price action itself is the most direct, most immediate, most honest representation of what the market is doing. Why look at a delayed version when you can look at the source? But simplification…
Continue reading in the MinuteRead app
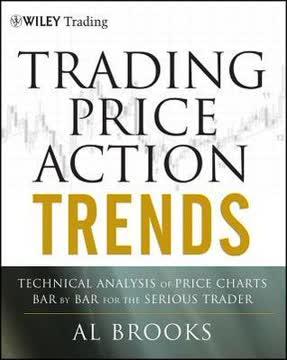
Get the complete 30-minute summary of Trading Price Action Trends
Get the complete summary in the appStrip away all indicators except one chart and one moving average. The bars are the truth.
Every bar is an institutional footprint. Learn to read who is in control.
About eighty percent of reversals and breakouts fail. Trade with the market's inertia.
The strongest trends deliberately look weak. Bad-looking entries are often the best trades.
Almost all trends have two phases: a spike and a channel. Trade each phase differently.
Use the always-in test. If you had to be in the market, would you rather be long or short? Trade that direction.
"Trading Price Action Trends" is a strong fit if you want practical ideas around finance, business, economics, especially themes like strip away all indicators except one chart and one moving average. the bars are the truth; every bar is an institutional footprint. learn to read who is in control. The MinuteRead summary distills these concepts into a focused read, whether you're deciding whether to buy the book or applying its lessons at work.
Al Brooks is a seasoned trader with over 30 years of experience in the financial markets. He has compiled his knowledge into a trilogy of books on price action trading, which are widely regarded as comprehensive courses for aspiring traders. Brooks is known for his detailed approach to analyzing charts and market behavior, focusing on bar-by-bar analysis and trend identification. His work emphasizes the importance of understanding price action without relying on indicators or news. While praised…
View all summaries by Al BrooksContinue Reading
Access the complete 30-minute summary and thousands more nonfiction books in the MinuteRead app.

Continue reading the complete summary in the MinuteRead app.