MinuteRead
30 min
Book summary
by Gregory L. Morris
Premium summary · Opens in the app · 30 min read
Every day, millions of traders stare at screens filled with numbers, charts, and indicators, searching for an edge. They read news reports, analyze earnings statements, and study economic data. Yet despite all this effort, most struggle to consistently understand what the market is telling them. The problem is not a lack of information. It is a lack of clarity.
### By Gregory L. Morris
**Estimated Reading Time:** 55 minutes
**What You'll Learn:**
* How to read candlestick charts as a visual language of market psychology * The essential single, double, and triple candle patterns that signal reversals and continuations * How to combine Japanese candlestick analysis with Western technical tools for greater reliability * The historical roots of candlestick charting and why they still matter today * A practical framework for applying candlestick analysis to real trading decisions
**Who This Book Is For:**
This condensed edition is for traders and investors who want to move beyond memorizing patterns and develop a genuine understanding of what candlestick charts reveal about market sentiment. Whether you are new to technical analysis or an experienced chartist looking to deepen your skills, this book will help you see price action through a clearer lens.
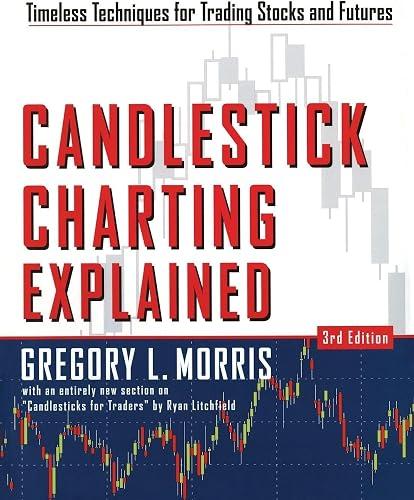
Every day, millions of traders stare at screens filled with numbers, charts, and indicators, searching for an edge. They read news reports, analyze earnings statements, and study economic data. Yet despite all this effort, most struggle to consistently understand what the market is telling them. The problem is not a lack of information. It is a lack of clarity. Japanese candlestick charting offers a solution to this problem. Developed centuries ago by rice traders in Japan, candlestick charts provide a way to see the psychology of the market at a glance. They transform raw price data into visual stories about fear, greed, hesitation, and conviction. A single candle can reveal whether buyers or sellers controlled a trading session. A combination of candles can signal that a trend is losing steam or gaining momentum. The challenge is that most people approach candlestick charting the wrong way. They memorize patterns without understanding what those patterns mean. They treat candlestick formations as mechanical signals rather than as expressions of human behavior. They fail to consider context, location, and confirmation. As a result, they experience false signals, missed opportunities, and frustration. Gregory L. Morris wrote Candlestick Charting Explained to address this problem. His goal was not simply to catalog patterns but to explain the reasoning behind them. He wanted to show traders how to read the message embedded in each candle, how to interpret patterns within the broader market context, and how to combine Eastern visual analysis with Western quantitative tools. The result is a comprehensive framework for understanding short-term price action. What makes Morris's approach distinctive is his insistence on rigor. He does not present candlestick patterns as magical predictors of future price movement. Instead, he treats them as tools for understanding the present moment in the market. Candlesticks reveal who is winning the battle between buyers and sellers right now. They show…
Continue reading in the MinuteRead app
Get the complete 30-minute summary of Candlestick Charting Explained
Get the complete summary in the appCandlestick charts reveal market psychology by emphasizing the relationship between open and close prices.
The body of a candle shows conviction, while the shadows show rejection and volatility.
Single candle lines like the Marubozu, Spinning Top, and Doji are the building blocks of all pattern analysis.
Reversal patterns signal potential trend changes but always require confirmation before acting.
Continuation patterns help you distinguish between temporary pauses and genuine reversals.
Location and context determine the significance of any candlestick pattern.
"Candlestick Charting Explained" is a strong fit if you want practical ideas around finance, business, money, especially themes like candlestick charts reveal market psychology by emphasizing the relationship between open and close prices; the body of a candle shows conviction, while the shadows show rejection and volatility. The MinuteRead summary distills these concepts into a focused read, whether you're deciding whether to buy the book or applying its lessons at work.
Motivated to help readers with japanese candlesticks offer a quick picture into the psychology of short-term trading, Gregory L. Morris wrote “Candlestick Charting Explained” to package those ideas for a fast, focused read. In “Candlestick Charting Explained”, Gregory L. Morris focuses on japanese candlesticks offer a quick picture into the psychology of short-term trading. Through “Candlestick Charting Explained”, Gregory L. Morris distills the core ideas on finance into lessons readers can abs…
Continue Reading
Access the complete 30-minute summary and thousands more nonfiction books in the MinuteRead app.

Continue reading the complete summary in the MinuteRead app.