MinuteRead
30 min
Most traders spend their careers chasing what already happened. They watch moving averages cross after the move is underway. They wait for momentum indicators to confirm what price already told them days ago. They buy breakouts that fail and sell breakdowns that reverse. The result is frustration, drawdowns, and the nagging sense that the market is rigged against them.
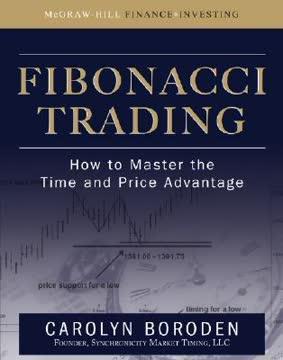
**Author:** Carolyn Boroden
**Estimated Reading Time:** 48 minutes
**What You'll Learn:**
- How Fibonacci ratios identify high-probability market turning points - The difference between retracements, extensions, and projections - How to build price clusters that signal strong trade setups - Why symmetry matters more than most traders realize - How to combine time and price analysis for better entries - A complete framework for building your own trading plan
**Who This Book Is For:**
This book is for traders who want to move beyond lagging indicators and understand where price is likely to turn before it happens. Whether you trade stocks, futures, forex, or ETFs, the methods here apply across all markets and time frames. If you have struggled with entries that feel random or exits that leave money on the table, this book provides a structured alternative.
Most traders spend their careers chasing what already happened. They watch moving averages cross after the move is underway. They wait for momentum indicators to confirm what price already told them days ago. They buy breakouts that fail and sell breakdowns that reverse. The result is frustration, drawdowns, and the nagging sense that the market is rigged against them. The market is not rigged. But it is structured in ways most traders never learn to see. Carolyn Boroden discovered this structure through Fibonacci ratios, the mathematical relationships that appear throughout nature, architecture, and financial markets. Her insight was not that Fibonacci numbers are magic. It was that they provide a reliable framework for identifying where price is likely to pause, reverse, or continue. When enough Fibonacci relationships converge in a tight zone, that zone becomes a high-probability decision point. The problem most traders face is not a lack of information. It is a lack of structure. They enter trades based on feelings, news, or indicators that lag price. They exit based on fear or greed rather than predefined levels. They have no systematic way to answer the most basic question in trading: where is price likely to go next? Fibonacci analysis answers that question with specific price levels derived from prior market swings. Instead of guessing, you measure. Instead of reacting, you anticipate. Instead of hoping, you plan. This book exists because Boroden saw too many traders losing money for reasons that were entirely preventable. She saw traders buying into resistance and selling into support because they did not know how to identify those levels in advance. She saw traders taking profits too early because they had no projection for where a move might end. She saw traders risking too much on low-probability setups because they had no way to distinguish a good trade from a bad one. Her approach is different…
Continue reading in the MinuteRead app
Get the complete 30-minute summary of Fibonacci Trading
Get the complete summary in the appFibonacci ratios identify potential support and resistance levels based on prior price swings.
Retracements tell you where pullbacks might end. The key levels are 38.2 percent, 50 percent, 61.8 percent, and 78.6 per
Extensions tell you where trends might go. The key levels are 127.2 percent and 161.8 percent.
Projections compare swings in the same direction. The 100 percent projection represents symmetry.
Price clusters are zones where multiple Fibonacci relationships converge. They are the highest-probability setups.
Symmetry is the tendency of market swings to equal each other. It provides specific targets based on prior behavior.
"Fibonacci Trading" is a strong fit if you want practical ideas around finance, economics, business, especially themes like fibonacci ratios identify potential support and resistance levels based on prior price swings; retracements tell you where pullbacks might end. the key levels are 38.2 percent, 50 percent, 61.8 percent, and 78.6 per. The MinuteRead summary distills these concepts into a focused read, whether you're deciding whether to buy the book or applying its lessons at work.
Carolyn Boroden is an experienced trader and technical analyst known for her expertise in Fibonacci trading techniques. She has developed a reputation as the "Fibonacci Queen" in the trading community. Boroden is a frequent contributor to financial media outlets and has appeared on CNBC and TheStreet.com. In addition to writing "Fibonacci Trading," she provides educational resources and analysis through her website FibonacciQueen.com. Boroden's approach focuses on using Fibonacci retracements an…
View all summaries by Carolyn BorodenContinue Reading
Access the complete 30-minute summary and thousands more nonfiction books in the MinuteRead app.

Continue reading the complete summary in the MinuteRead app.