MinuteRead
30 min
Book summary
Premium summary · Opens in the app · 30 min read
Most people enter the financial markets with a simple hope: buy low, sell high, and make money. They bring enthusiasm, some capital, and perhaps a few tips collected from friends or television experts. What they rarely bring is a coherent method for understanding what prices are actually telling them. The result is predictable. They buy after a stock has already risen, panic when it falls, and sell at the worst possible moment. They repeat this cycle until their capital is depleted or their conf
**Author:** Ashwani Gujral
**Estimated Reading Time:** 45 minutes
**What You'll Learn:**
- How to read chart patterns as footprints of market psychology - How to measure trend strength using the ADX indicator - How to use trend lines, volume, and open interest to confirm price action - How to apply momentum indicators for precise entries and exits - How to protect your capital through disciplined money management - How to identify winning sectors before selecting individual stocks - How to apply the Railway-Line Theory for capturing sustained trends - How to develop the mental discipline that separates winners from losers
**Who This Book Is For:**
This book is for anyone who wants to understand the language of charts. Whether you are a beginner trying to make sense of price movements or an experienced trader looking to refine your approach, the principles here apply across markets, timeframes, and instruments. If you have ever felt confused by conflicting advice, overwhelmed by indicators, or frustrated by losses that seemed avoidable, this book offers a clear, practical framework for thinking about markets with greater clarity.
Most people enter the financial markets with a simple hope: buy low, sell high, and make money. They bring enthusiasm, some capital, and perhaps a few tips collected from friends or television experts. What they rarely bring is a coherent method for understanding what prices are actually telling them. The result is predictable. They buy after a stock has already risen, panic when it falls, and sell at the worst possible moment. They repeat this cycle until their capital is depleted or their confidence is destroyed. Ashwani Gujral wrote this book to address a fundamental gap in how most people approach trading. The gap is not a lack of information. There is more market data available today than at any point in history. The gap is not a lack of indicators. Traders have access to hundreds of technical tools. The gap is a lack of understanding about what all this information means and how to use it in a disciplined, repeatable way. The central premise of this book is both simple and profound: markets are driven by human emotion, and human emotion leaves visible traces on price charts. Greed, fear, hope, and ignorance have driven market participants for centuries. These emotions create patterns that repeat with remarkable consistency. A chart is not just a collection of random price movements. It is a record of collective human behavior, a footprint of the ongoing battle between buyers and sellers. Gujral's approach is grounded in technical analysis, the study of price action and market data to forecast future movements. But he is careful to distinguish between technical analysis as a discipline and…
Continue reading in the MinuteRead app
Get the complete 30-minute summary of How to Make Money Trading with Charts
Get the complete summary in the appCharts are footprints of human behavior. Read them as records of the battle between buyers and sellers.
The ADX tells you whether the market is trending or ranging. Use it to choose the right strategy.
Trend lines define market structure. A break of a trend line signals a potential trend change.
Volume confirms price moves. Never trust a breakout without volume support.
Momentum indicators provide timing. Use trend-following indicators in trends and oscillators in ranges.
Risk no more than 2% of your capital on any single trade.
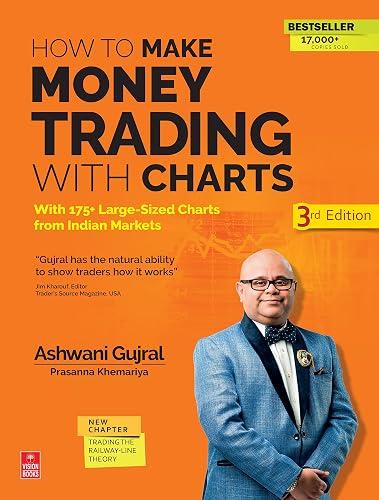
"How to Make Money Trading with Charts" is a strong fit if you want practical ideas around finance, business, money, especially themes like charts are footprints of human behavior. read them as records of the battle between buyers and sellers; the adx tells you whether the market is trending or ranging. use it to choose the right strategy. The MinuteRead summary distills these concepts into a focused read, whether you're deciding whether to buy the book or applying its lessons at work.
Motivated to help readers with “All through time, Ashwani Gujral wrote “How to Make Money Trading with Charts” to package those ideas for a fast, focused read. In “How to Make Money Trading with Charts”, Ashwani Gujral focuses on “All through time. Through “How to Make Money Trading with Charts”, Ashwani Gujral distills the core ideas on finance into lessons readers can absorb in a single short sitting. Readers turn to this work when they want Ashwani Gujral's perspective on the subject without …
View all summaries by Ashwani GujralContinue Reading
Access the complete 30-minute summary and thousands more nonfiction books in the MinuteRead app.

Continue reading the complete summary in the MinuteRead app.