MinuteRead
30 min
Book summary
Premium summary · Opens in the app · 30 min read
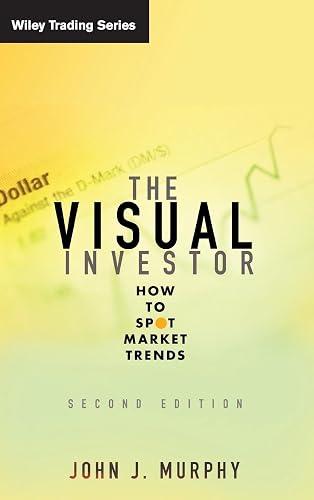
Every day, millions of investors make decisions based on information that is incomplete, outdated, or simply wrong. They read earnings reports that reflect the past, listen to analysts who missed the last major turn, and study economic indicators that lag the market by months. Meanwhile, the market itself is speaking clearly and continuously through the only piece of information that never lies: price.
**Author:** John J. Murphy **Estimated Reading Time:** 45 minutes
How to read price charts with confidence, identify trends before they become obvious, use technical indicators to time your decisions, understand how different markets influence one another, and build a complete visual investing system that works across stocks, bonds, commodities, and currencies.
Individual investors who feel overwhelmed by financial data, fundamental analysts who want to add timing tools to their toolkit, traders seeking a systematic approach to market analysis, and anyone who has ever looked at a price chart and wondered what it was trying to tell them.
Every day, millions of investors make decisions based on information that is incomplete, outdated, or simply wrong. They read earnings reports that reflect the past, listen to analysts who missed the last major turn, and study economic indicators that lag the market by months. Meanwhile, the market itself is speaking clearly and continuously through the only piece of information that never lies: price. John J. Murphy spent decades watching investors struggle with the same fundamental problem. They had access to more information than ever before, yet their results did not improve. The reason, he discovered, was not a lack of data but a lack of focus. They were looking everywhere except at the one thing that actually mattered: what the market was doing right now. The Visual Investor was written to solve this problem. Murphy's central argument is both simple and profound: all known information about a market is already reflected in its price. When a stock rises, it rises because buyers are more motivated than sellers. When it falls, the opposite is true. The reasons behind those motivations may be complex, but the visual investor does not need to understand them all. The chart tells the story. This approach represents a fundamental shift in how individual investors think about markets. Traditional fundamental analysis asks you to become an expert in accounting, economics, industry dynamics, and competitive strategy. It demands that you read financial statements, track earnings revisions, and understand complex valuation models. Even after all that work, you still face the challenge of timing: knowing when to buy and when to sell. Visual investing bypasses this complexity. It treats the market as a living system whose collective wisdom is expressed through price action. When you learn to read charts, you are learning to read the aggregated decisions of every market participant, from the largest institutional investor to the smallest retail trader. You are seeing the truth of supply and demand as it unfolds in real time. The speed advantage alone makes this approach worth learning. A skilled visual investor can scan hundreds of charts in a single session, identifying which markets are…
Continue reading in the MinuteRead app
Get the complete 30-minute summary of The Visual Investor
Get the complete summary in the appPrice action is the ultimate source of truth. All known information is already reflected in the price.
The trend is your friend. Never fight the trend.
An uptrend is defined by higher peaks and higher troughs; a downtrend by lower peaks and lower troughs.
Support and resistance are psychological barriers. Broken resistance becomes support, and broken support becomes resista
Volume confirms price action. A move without volume is suspect.
Divergence between price and momentum warns of impending trend changes.
"The Visual Investor" is a strong fit if you want practical ideas around finance, business, economics, especially themes like price action is the ultimate source of truth. all known information is already reflected in the price; the trend is your friend. never fight the trend. The MinuteRead summary distills these concepts into a focused read, whether you're deciding whether to buy the book or applying its lessons at work.
Motivated to help readers with all that matters is what the markets are actually doing, John J. Murphy wrote “The Visual Investor” to package those ideas for a fast, focused read. In “The Visual Investor”, John J. Murphy focuses on all that matters is what the markets are actually doing. Through “The Visual Investor”, John J. Murphy distills the core ideas on finance into lessons readers can absorb in a single short sitting. Readers turn to this work when they want John J. Murphy's perspective o…
View all summaries by John J. MurphyContinue Reading
Access the complete 30-minute summary and thousands more nonfiction books in the MinuteRead app.

Continue reading the complete summary in the MinuteRead app.